

LPS
IT services
Linux Professionnal Services
IT consulting and outsourcing
Expert in Free Software - GNU/Linux
Our core business : systems and networks engineering.
We can help you in the management and implementation of your IT tools, whether for a website or a complex information system.
We work as consultant for SME who needs IT expertise, and as a systems engineer in big web hosting companies.
References


IRISccg
WebDesign
WebDesign
CRDP
Nice
Nice
Orange
Hosting
Hosting
Nuxit
Hosting
Hosting
Publications
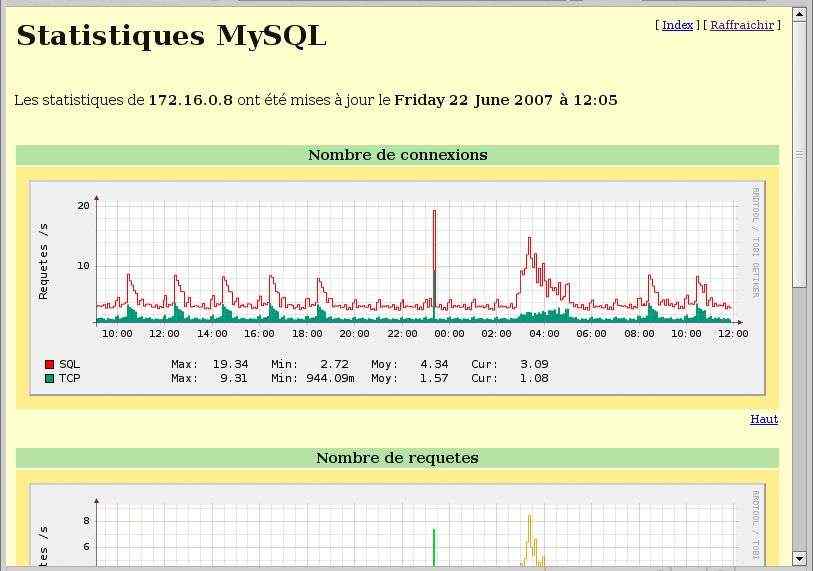
MyRRD is a tool that allows you to monitor the activity of a MySQL server.
It is composed of two parts: a sensor that collects information from MySQL and a PHP page that uses RRDtool to generate graphs. The data are diplayed with curves reflecting the daily, weekly, monthly and yearly activites. A zoom page also allows you to browse the history.
The PHP library rrd.inc.php can also be used to graph any data from an RRD database.
The following counters are displayed for MySQL :
Needed dependencies : rrdtool, php for graphs generation, and rrdtool-perl, perl-DBD-MySQL for the MySQL sensor.
1) Copy mysql-rrd.pl into /usr/local/sbin/ with execution right for root.
You have to edit the begining of this script to configure the database access (MySQL host, login, password). The show global status privilege is needed for this user.
2) Create the file /etc/cron.d/myrrd with the following line, to retrieve data every five minutes.
-*/5 * * * * root /usr/local/sbin/mysql-rrd.pl
3) Copy the two PHP scripts (myrrd.php and rrd.inc.php) into your web document root, for example /var/www/html/myrrd/.
This directory has to be writable by the PHP process as it is used to store the generated image files. PHP files themselves must be own by the web server account. (chown -R apache. /var/www/html/myrrd for example)
If php_safe is enabled, you have to create a symlink pointing to rrdtool in the directory defined by safe_mode_exec_dir in your php.ini. Example :
ln -s /usr/bin/rrdtool /var/www/php_exec_dir
4) Finally, create the RRD database :
/usr/local/sbin/mysql-rrd.pl init
By default, the RRD database is /var/lib/mysql.rrd.
After a few minutes, you can browse the MySQL activity pointing to your web server, here : http://your-web-server/myrrd/myrrd.php.
Click on a graph to see details.
It is composed of two parts: a sensor that collects information from MySQL and a PHP page that uses RRDtool to generate graphs. The data are diplayed with curves reflecting the daily, weekly, monthly and yearly activites. A zoom page also allows you to browse the history.
The PHP library rrd.inc.php can also be used to graph any data from an RRD database.
The following counters are displayed for MySQL :
- Total request number for select, insert, delete and update queries,
- Total number of TCP ans UNIX connections,
- Input and output bandwith.
Screenshots :
Download :
myrrd-1.2.tgz [ md5: a9f23a98a375899f1e11c505ad552f45 ]
Installation notes:
Needed dependencies : rrdtool, php for graphs generation, and rrdtool-perl, perl-DBD-MySQL for the MySQL sensor.
1) Copy mysql-rrd.pl into /usr/local/sbin/ with execution right for root.
You have to edit the begining of this script to configure the database access (MySQL host, login, password). The show global status privilege is needed for this user.
2) Create the file /etc/cron.d/myrrd with the following line, to retrieve data every five minutes.
-*/5 * * * * root /usr/local/sbin/mysql-rrd.pl
3) Copy the two PHP scripts (myrrd.php and rrd.inc.php) into your web document root, for example /var/www/html/myrrd/.
This directory has to be writable by the PHP process as it is used to store the generated image files. PHP files themselves must be own by the web server account. (chown -R apache. /var/www/html/myrrd for example)
If php_safe is enabled, you have to create a symlink pointing to rrdtool in the directory defined by safe_mode_exec_dir in your php.ini. Example :
ln -s /usr/bin/rrdtool /var/www/php_exec_dir
4) Finally, create the RRD database :
/usr/local/sbin/mysql-rrd.pl init
By default, the RRD database is /var/lib/mysql.rrd.
After a few minutes, you can browse the MySQL activity pointing to your web server, here : http://your-web-server/myrrd/myrrd.php.
Click on a graph to see details.
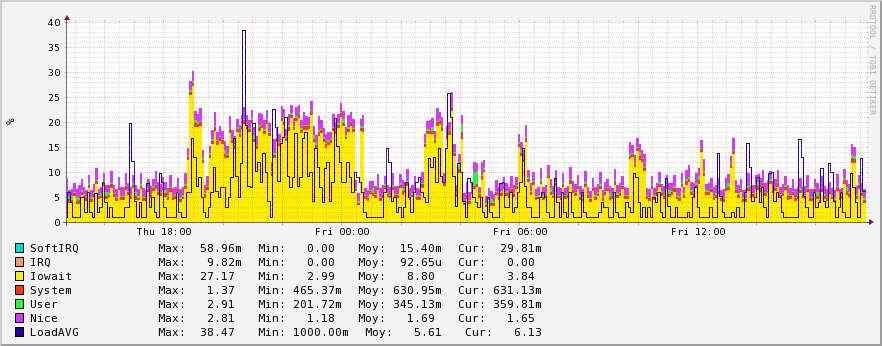
RRD sensors are a rewrite of my old MRTG scripts improved for RRDtool. They give many informations on your system health.
These scripts are run periodically by cron (every five minutes, for example) to fill RRD databases.
Then you can generate graph with MyRRD to view your datas.
List of available sensors :
A description of each sensors and documentation is available here : RRD sensors
Here is an example for the CPU load on a server :
These scripts are run periodically by cron (every five minutes, for example) to fill RRD databases.
Then you can generate graph with MyRRD to view your datas.
List of available sensors :
- CPU load
- RAM usage
- Network activity
- SMART reports
- XEN metrics (CPU and RAM dof virtuals machines)
- CPU frequency with XEN
A description of each sensors and documentation is available here : RRD sensors
Here is an example for the CPU load on a server :
ECaMM is a tool, written in Java, created for a specific professionnal need, and released under GNU/GPL.
It is a multi-users Help-Desk software. It was designed to help an IT department to manage requests for assistance and incidents on a server pool. It offers a collaborative management for monitoring applications and a history as a basis of knowledge.
ECaMM require a Mysql server, at least version 5.1. The database has to be created manually before use. The initialization script in the documentation archive.
- Documentation : ecamm-docs.zip
- Source code : ECaMM-2.1-src.zip
[ md5: 42215324f76cc54a5fa24630093dd3ef ]
- Binaries (JAR): ECaMM-v2.1.jar
[ md5: 4cf4c2fcba3611c0e29dd78c76ff0cd2 ]
It is a multi-users Help-Desk software. It was designed to help an IT department to manage requests for assistance and incidents on a server pool. It offers a collaborative management for monitoring applications and a history as a basis of knowledge.
ECaMM require a Mysql server, at least version 5.1. The database has to be created manually before use. The initialization script in the documentation archive.
Downloads :
- Documentation : ecamm-docs.zip
- Source code : ECaMM-2.1-src.zip
[ md5: 42215324f76cc54a5fa24630093dd3ef ]
- Binaries (JAR): ECaMM-v2.1.jar
[ md5: 4cf4c2fcba3611c0e29dd78c76ff0cd2 ]
Net-SNMP Python backend, is a plugin for Net-SNMP using the pass_persist protocol.
Il allows to use the Python langage to send any kind of informations to the snmp daemon.
This module is also available on PyPI.
More informations here : github.com/nagius/snmp_passpersist
Il allows to use the Python langage to send any kind of informations to the snmp daemon.
This module is also available on PyPI.
More informations here : github.com/nagius/snmp_passpersist
Clustered Xen Manager, also called cxm, is a set of tools and an API that help you manage a cluster of xen servers.
It can automate actions like loadbalancing, fencing, and failover between xen nodes.
In addition, the plugin CXM drivers for OpenNebula allow you to integrate this software stack in OpenNebula and thus provide an OpenSource Cloud Computing solution, efficient and resistant to failures
More informations here : github.com/nagius/cxm